ImageColorAnalysisTool-图像颜色分析工具-Matlab GUI版
¶Image Color Analysis Tool
An image tool for color clustering based on K-means.
¶Usage
¶Download
You can get the last version from Release page or download from Mathworks File Exchanges .
¶Install
Double click on Image Color Analysis Tool.mlappinstall to install the application, and you can find it in Matlab>App.
![]()
¶Run
¶1. Open image
ClickFile>Open to select a image.
¶2. Set color number
Click Analysis>Set Cluster Number to set cluster number for k-means clustering.
¶3. Analysis
Click Analysis>Run to start analysis the color distribution.
¶4. Result View
There are three panes:
-
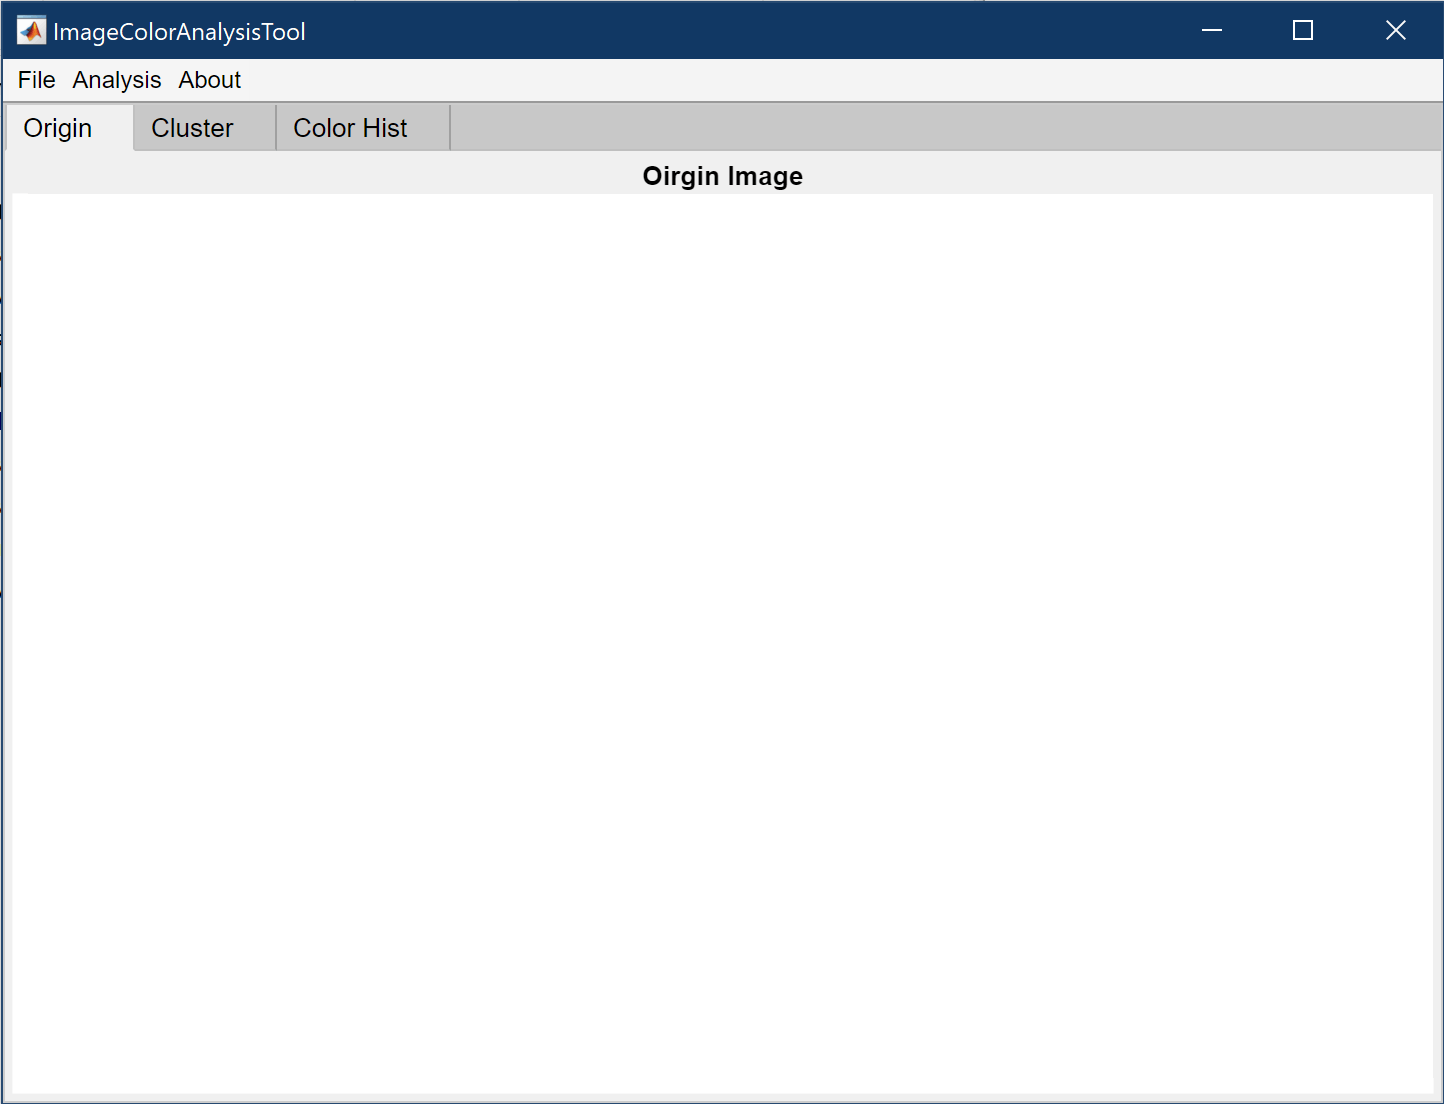
Origin: the image you import. -
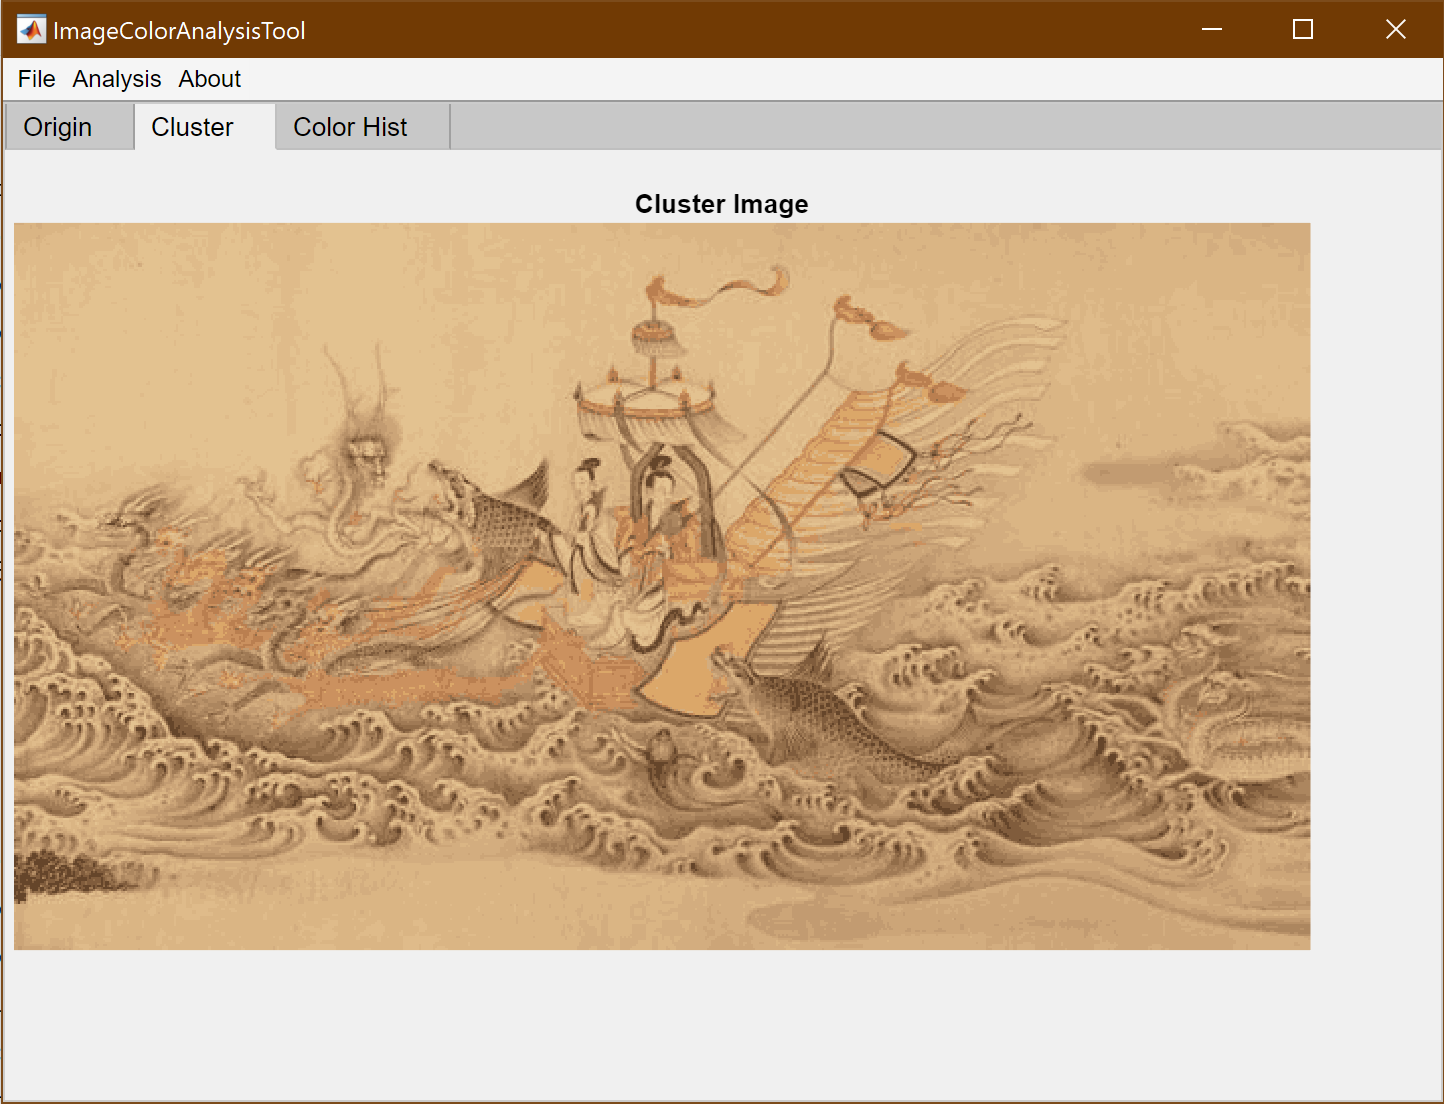
Cluster: the image after k-means clustering. -
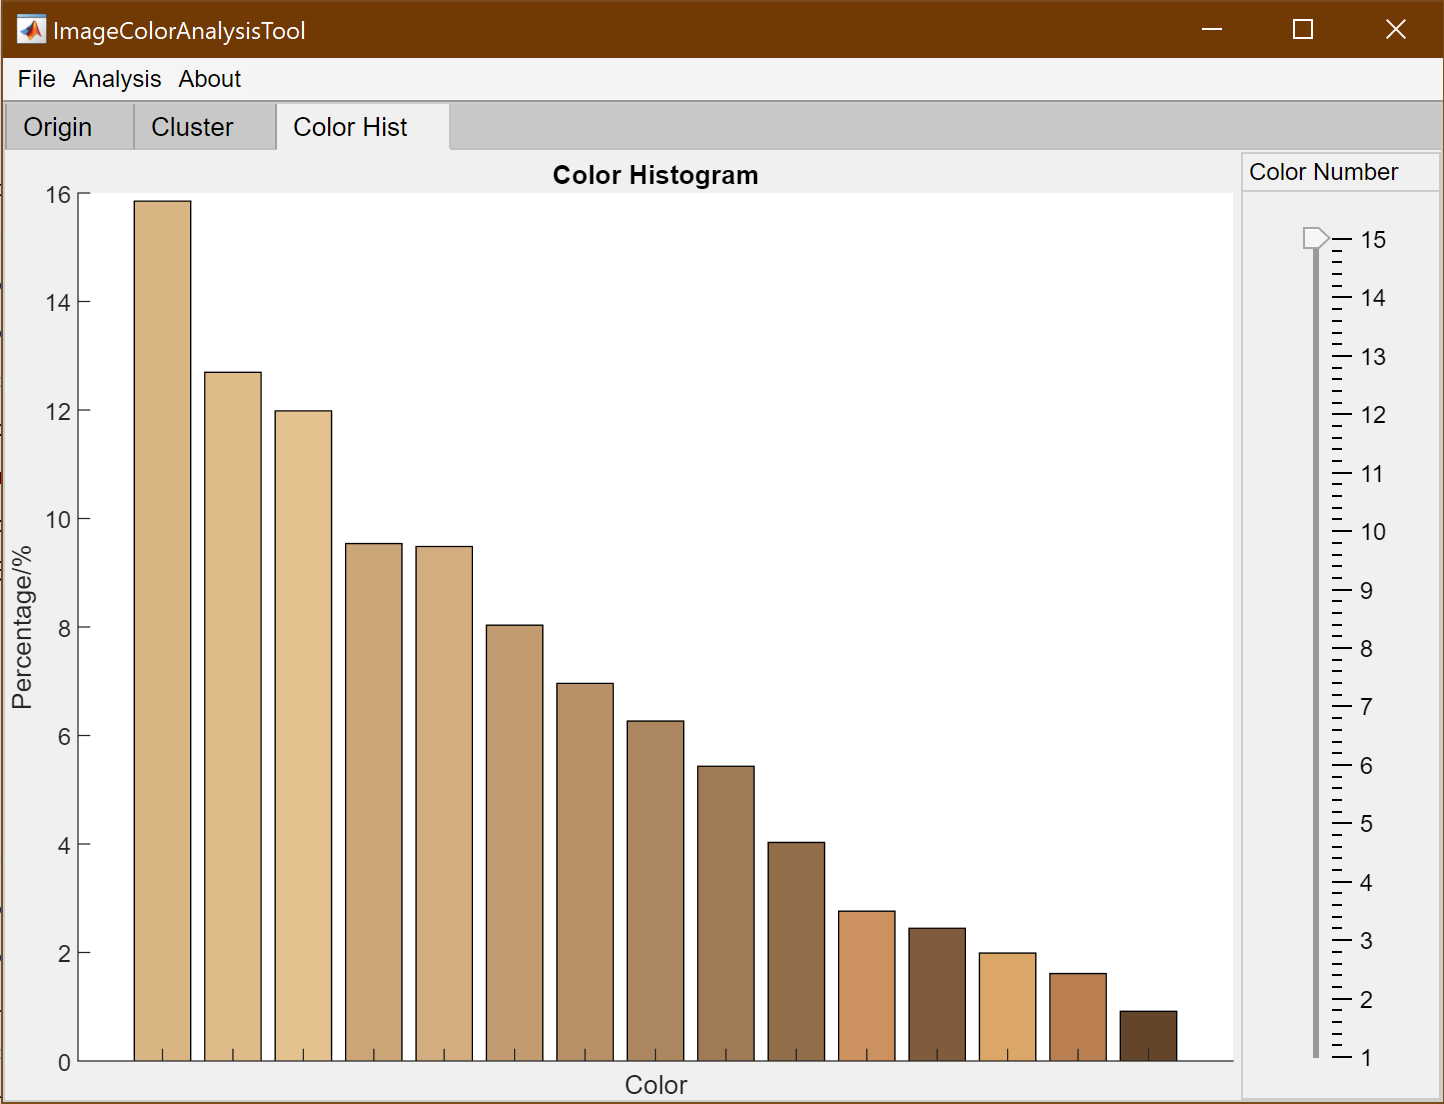
Color Hist: the histogram of main colors in image.
You can adjust Cluster Number by comparing the image between Origin and Cluster.
Also, the color number in Color Histogram can be adjust by the slider.
¶5. Others
Other features:
-
File>Save>Cluster Image: Export the cluster image. -
File>Save>Color Hist Image: Export the figure of color histogram.
¶Source Code
¶Author
 Wechat
 Alipay

![[徒步]宁波九龙爱心线](https://i.cuger.cn/b/d3c7f637-f0a4-4cfb-8e2b-23631aaba006.jpg)
![[徒步]仙居公盂徒步+丽人谷溯溪(多图)](https://i.cuger.cn/b/d9792528-29aa-4af0-98b5-979472c57b77.jpg)
![[出差]内蒙草原风光](https://i.cuger.cn/b/0039bc8f-15e8-4039-a286-9fb1d1af9e33.jpg)