通过三个点绘制三维圆弧-python
通过圆弧的圆心及两个端点坐标,绘制圆弧的三维形状。
¶Introduction
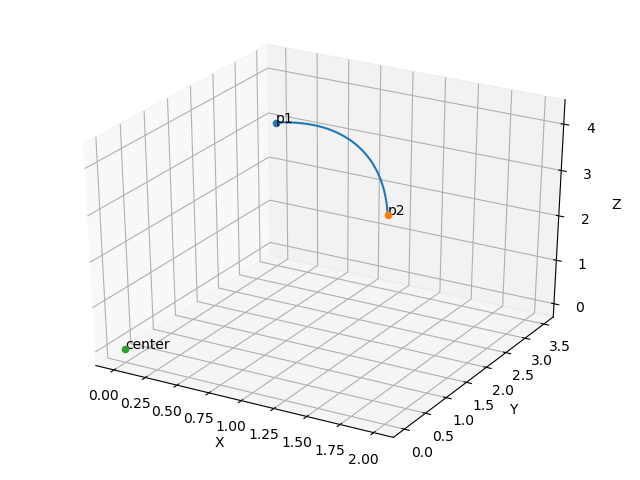
起源于某同学今年打研究生数学建模竞赛。绘制飞机航迹图。通过中心点坐标c(x,y,z)、端点坐标1p1(x,y,z)和端点坐标2p2(x,y,z),绘制三维圆弧。起初以为很简单,接锅后发现事情不简单。。。
¶Method
主要思路为:通过将圆弧端点c,p1,p2旋转到XOY平面,插值后,再旋转回原平面。
主要步骤如下:
-
计算
c, p1, p2三点共面的平面法向量cp -
通过平面法向量
cp,计算其与z轴夹角sita及旋转轴roteAxis -
通过旋转轴
roteAxis和sita计算旋转矩阵roteMatrix和逆向旋转矩阵roteBackMatrix -
将
c,p1,p2旋转到XOY平面,根据step插值得到弧线点坐标roteArc -
利用
roteBackMatrix将roteArc旋转到原坐标系, 得到圆弧曲线坐标arc
¶Code
¶arc.py
1 | #!/usr/bin/python3 |
¶Example
可通过下载 GitHub 上的代码使用该函数, 使用方法如下:
1 | from arc import get_arc_points |
¶Others
Email: ddxid@outlook.com
本博客所有文章除特别声明外,均采用 CC BY-NC-SA 4.0 许可协议。转载请注明来源 遐说!
 Wechat
 Alipay
相关推荐
2024-05-12
Python读取NetCDF文件-裁剪&计算
近期项目又开始倒腾NetCDF文件了,处理全国降雨数据,记录一下代码片段。
2019-03-04
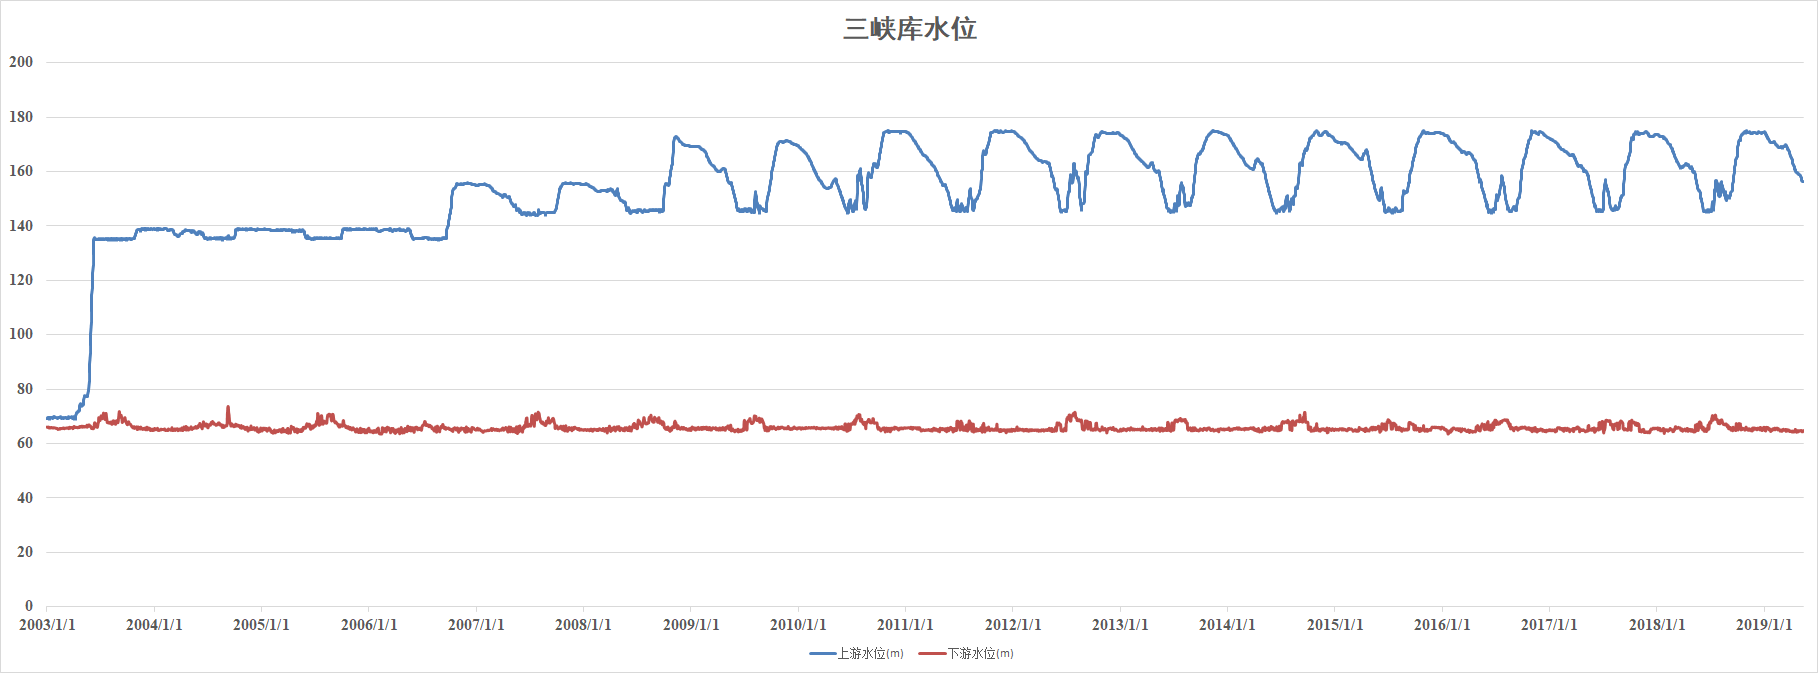
长江流域三峡库区水情水位信息获取
【原方法已失效,请看更新】
2020-04-19
图像主要颜色分析工具(pyImageColorAnalysisTool)
¶pyImageColorAnalysisTool This tool is designed to analysis color distribution of image based on k-means cluster. ¶Usage ¶Download 1git clone https://github.com/Doradx/pyImageColorAnalysisTool.git ¶Install requirements 1pip install -r requirements ¶Run 1python main.py ¶Example 1234567891011主要颜色及占比:RGB(59,119,137):16.40%RGB(27,93,25):16.00%RGB(187,141,121):15.60%RGB(219,231,204):12.40%RGB(122,47,186):12.00%RGB(161,238,104):11.60%RGB(15,200,34):4.00%RGB(229,67,60):4.00%RGB(9,211,167):4.00%RG...
评论

![[徒步]宁波九龙爱心线](https://i.cuger.cn/b/d3c7f637-f0a4-4cfb-8e2b-23631aaba006.jpg)
![[徒步]仙居公盂徒步+丽人谷溯溪(多图)](https://i.cuger.cn/b/d9792528-29aa-4af0-98b5-979472c57b77.jpg)
![[出差]内蒙草原风光](https://i.cuger.cn/b/0039bc8f-15e8-4039-a286-9fb1d1af9e33.jpg)